Chapter 7 Calculate Mussel Metrics
This chapter will describe how to calculate metrics of habitat quality for each sampled site. Each of these metrics will be used as presence data as input to create a set of Maxent habitat suitability models. The metrics calculated in this section were taken from the Upper Mississippi River Mussel Community Assessment Tool (MCAT) (Dunn, Zigler, and Newton 2016).
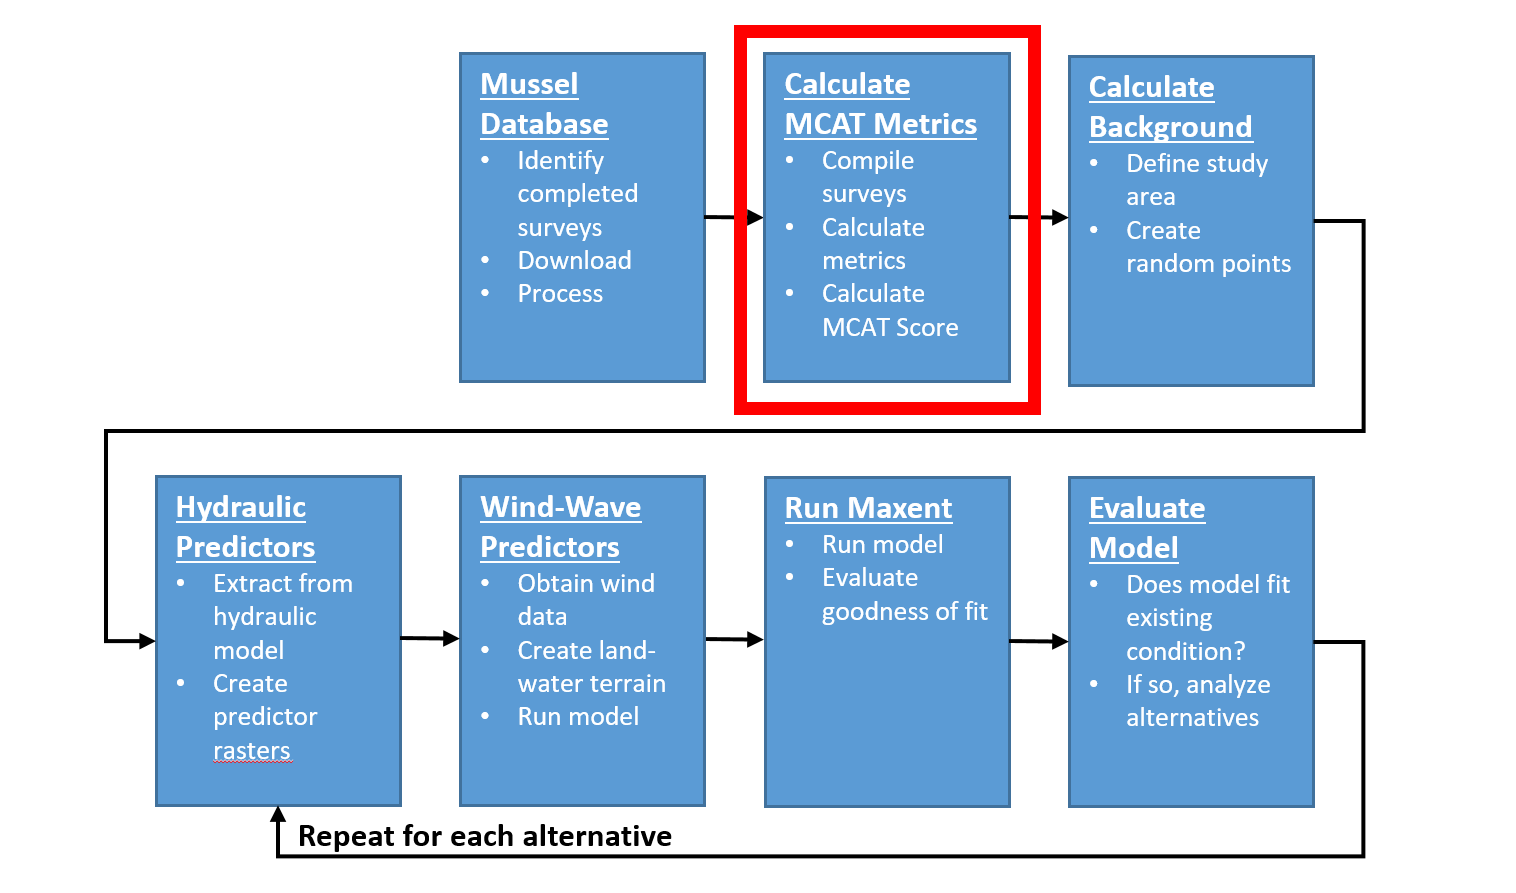
Figure 7.1: HREP Mussel Modeling Workflow, Calculate MCAT Metrics Step.
7.1 MCAT Metrics
The purpose of this step is to describe the MCAT metrics used in this study. The following MCAT metrics were selected for inclusion in the model:
percent listed species- Percent of listed threatened or endangered species (federal or bordering states) is a measure of sensitive species.percent tolerant- Percent of tolerant species (Amblema plicata, Quadrula quadrula, and Obliquaria reflexa) is a measure of a highly disturbed mussel assemblage (i.e., dominated by species tolerant of unstable substrates, silt accumulation, low current velocities, and fluctuating flow conditions).percent tribe Lampsilini- Percent of assemblage that falls within tribe Lampsilini is a measure of species composition, life history, and behavioral characteristics.percent juveniles- Percent of mussels <= 5 years-old is a measure of recruitment into an assemblage over the past five years.percent >= 15 yrs- Percent of mussels >= 15 years-old is a measure of age distribution in an assemblage.abundance- A measure of abundance calculated as the density (no./\(m^2\)).species evenness- Species evenness represents the dominance of an assemblage by a few species using Pielou’s evenness index (range 0 to 1).tribe evenness- Tribe evenness represents the dominance of a particular taxonomic group using Pielou’s evenness index (range 0 to 1).ES_100- The expected number of species with a sample size of 100 estimated by rarefaction is a measure of a healthy mussel assemblage.
7.2 Include Live Mussels Only Prior to Metrics Calculations
Create a definition query on the Cordova_all_individuals feature class where `NumberLive > 0.
7.3 Create Percent Listed
The purpose of this step is to calculate the percent listed MCAT metric for each sampled site.
- Determine which mussels in the
Cordova_all_individualsfeature class are listed and set the flag field. Use the list below to select each of the following species and set the flagListedfield equal to one.
UMR Listed Species
- Cumberlandia monodonta
- Elliptio crassidens
- Elliptio dilatata
- Ellipsaria lineolata
- Fusconia ebena
- Lampsilis higginsii
- Lampsilis teres teres
- Lampsilis teres anodontoides
- Ligumia recta
- Plethobasus cyphyus
- Potamilus capax
Simpsonaias ambigua
- Dissolve the
Cordova_all_individualsfeature class bySAMPLE_ID. AddSUM_NumberLiveandSUM_Listedfields in the Statistics section of the tool. Uncheck create multipart features. Set Output Feature Class to the working .gdb and name itPercentListed. - Open the
PercentListedattribute table. Add a field titledperc_listedType = double. Use the Field Calculator tool to calculate the percent of individual listed species per sampled quadrat using the expression
([SUM_Listed] / [SUM_NumberLive]) * 100.
7.4 Create Percent Tolerant
The purpose of this step is to calculate the percent tolerant MCAT metric for each sampled site.
- Determine which mussels in the
Cordova_all_individualsfeature class are considered tolerant and set the flag field. Use the list below to select each of the following species and set the flagTolerantfield equal to one.
Tolerant Species
- Amblema plicata
- Obliquaria reflexa
Quadrula quadrula
- Dissolve the
Cordova_all_individualsfeature class bySAMPLE_ID. AddSUM_NumberLiveandSUM_Tolerantfields in the Statistics section of the tool. Uncheck create multipart features. Set Output Feature Class to the working .gdb and name itPercentTolerant. - Open the
PercentTolerantattribute table. Add a field titledperc_tolerantType = double. Use the Field Calculator tool to calculate the percent of individual tolerant species per sampled quadrat using the expression
([SUM_Tolerant] / [SUM_NumberLive]) * 100.
7.5 Create Percent Tribe Lampsilini
The purpose of this step is to calculate the percent tribe Lampsilini MCAT metric for each sampled site.
- Determine which mussels in the
Cordova_all_individualsfeature class are in the Lampsilini tribe and set the flag field. Use the list below to select each of the following species and set the flagLampsilinifield equal to one.
Lampsilini Tribe
- Actinonaias ligamentina
- Ellipsaria lineolata
- Lampsilis cardium
- Lampsilis higginsii
- Lampsilis teres (teres)
- Leptodea fragilis
- Ligumia recta
- Obliquaria reflexa
- Obovaria olivaria
- Potamilus alatus
- Potamilus capax
- Potamilus ohiensis
- Toxolasma parvum
- Truncilla donaciformis
Truncilla truncata
- Dissolve the
Cordova_all_individualsfeature class bySAMPLE_ID. AddSUM_NumberLiveandSUM_Lampsilinifields in the Statistics section of the tool. Uncheck create multipart features. Set Output Feature Class to the working .gdb and name itPercentLampsilini. - Open the
PercentLampsiliniattribute table. Add a field titledperc_lampsiliniType = double. Use the Field Calculator tool to calculate the percent of individual tolerant species per sampled quadrat using the expression
([SUM_Lampsilini] / [SUM_NumberLive]) * 100.
7.6 Create Percent Juveniles
The purpose of this step is to calculate the percent juveniles MCAT metric for each sampled site.
- Determine which mussels in the
Cordova_all_individualsfeature class are <= 5 years-old. Sort theAgefield in ascending order to select mussels aged 5 and under. Use the Field Calculator to set the flagJuvenilesfield equal to one. - Dissolve the
Cordova_all_individualsfeature class bySAMPLE_ID. AddSUM_NumberLiveandSUM_Juvenilesfields in the Statistics section of the tool. Uncheck create multipart features. Set Output Feature Class to the working .gdb and name itPercentJuveniles. - Open the
PercentJuvenilesattribute table. Add a field titledperc_juvenilesType = double. - Use the Field Calculator tool to calculate the percent of individual tolerant species per sampled quadrat using the expression
([SUM_Juveniles] / [SUM_NumberLive]) * 100.
7.7 Create Percent Over 15 Years
The purpose of this step is to calculate the percent over 15 years old MCAT metric for each sampled site.
- Determine which mussels in the
Cordova_all_individualsfeature class are >= 15 years-old. Sort theAgefield in ascending order to select mussels aged 15 and over. Use the Field Calculator to set the flagOver_15yrsfield equal to one. - Dissolve the
Cordova_all_individualsfeature class bySAMPLE_ID. AddSUM_NumberLiveandSUM_Over_15yrsfields in the Statistics section of the tool. Uncheck create multipart features. Set Output Feature Class to the working .gdb and name itPercentOver15yrs. - Open the
PercentOver15yrsattribute table. Add a field titledperc_over_15yrsType = double. - Use the Field Calculator tool to calculate the percent of individual tolerant species per sampled quadrat using the expression
([SUM_Over_15yrs] / [SUM_NumberLive]) * 100.
7.8 Create Abundance
The purpose of this step is to calculate the Abundance MCAT metric for each sampled site.
- For the abundance metric, dissolve
Cordova_all_individualsbySAMPLE_ID. Add ‘SUM_NumberLive’ field in the Statistics section of the tool. Uncheck create multipart features. Set Output Feature Class to the working .gdb and name itAbundance.
# Import Abundance from geodatabase
abundance_sp <- arc2sp("//mvrdfs/EGIS/Work/EMP/HREP_Projects/SteamboatSlough/Mussels/SteamboatMusselModel/Data/SB_Mussels.gdb/SB_ILStatePlaneW/Abundance")

# Convert sp object to a data frame
abundance <- abundance_sp@data

# Remove OBJECTID field
abundance <- abundance[,-1]
# Convert from num. of mussels per 0.25 sq m to num. per 1.0 square m
abundance$num_sq_m <- abundance$SUM_NumberLive * 4
# Calculate the quantiles
q <- quantile(abundance$num_sq_m)
q## 0% 25% 50% 75% 100%
## 4 4 8 20 180# Merge the abundance scores back onto the sp object
sample_abundance <- sp::merge(x = abundance_sp,
y = abundance,
by.x = "SampleID", by.y = "SampleID")# Export to geodatabase
sp2arc(sample_abundance, fc_path = "//mvrdfs/EGIS/Work/EMP/HREP_Projects/SteamboatSlough/Mussels/SteamboatMusselModel/Data/SB_Mussels.gdb/SB_ILStatePlaneW/sample_abundance")7.9 Create Species Evenness
The purpose of this step is to calculate the Pielou’s evenness index (range 0-1), estimated at the species level for each sampled site.
- Create a table of SampleID by species by abundance (number live). Use the
Dissolvetool:- Input Features:
Cordova_all_individuals - Output feature class:
Cordova_sampleid_species - Dissolve Fields:
SampleID,EName - Statistics Fields:
NumberLive, SUM - Create Multipart: unchecked
- Input Features:
Ensure that the Cordova_sampleid_species feature class is of type Point Features and not Multipoint Features. If multipoint, then use the Multipart to Singlepart tool to convert from multipoint to point feature type.
# Import ArcGIS feature class into R
cordova_sampleid_species <- arc2sp("//mvrdfs/EGIS/Work/EMP/HREP_Projects/SteamboatSlough/Mussels/SteamboatMusselModel/Data/SB_Mussels.gdb/SB_ILStatePlaneW/Cordova_sampleid_species")

# Convert sp object to a data frame
sample_species <- cordova_sampleid_species@data

# Remove OBJECTID field
sample_species <- sample_species[,-1]

# Convert to vegan community data matrix-like format using labdsv::matrify
sample_species_matrix <- labdsv::matrify(sample_species)
# Calculate the Shannon-Weaver diversity index
shannon_diversity <- vegan::diversity(sample_species_matrix, index = "shannon")
# Calculate the number species per site (see ?vegan::diversity)
species_number <- vegan::specnumber(sample_species_matrix)
# Use the following equation to calculate Pielou's evenness
# See the vegan Diversity Vignette for details
pielou_evenness <- shannon_diversity/log(species_number)
# Set NaN pielou_evenness values to zero
pielou_evenness <- ifelse(is.nan(pielou_evenness), 0, pielou_evenness)
# Create a data frame of results
pielou <- data.frame(sampleid = names(pielou_evenness),
shannon_diversity,
species_number,
pielou_evenness)# Merge the Pielou scores back onto the sp object
sample_species_pielou <- sp::merge(x = cordova_sampleid_species,
y = pielou,
by.x = "SampleID", by.y = "sampleid")# Export to geodatabase
sp2arc(sample_species_pielou, fc_path = "//mvrdfs/EGIS/Work/EMP/HREP_Projects/SteamboatSlough/Mussels/SteamboatMusselModel/Data/SB_Mussels.gdb/SB_ILStatePlaneW/sample_species_pielou")- Create a table of SampleID by species Pielou evenness score. Use the
Dissolvetool:- Input Features:
sample_species_pielou - Output feature class:
species_pielou - Dissolve Fields:
SampleID - Statistics Fields:
shannon_diversity, MEANspecies_number, MEANpielou_evenness, MEAN - Create Multipart: unchecked
- Input Features:
7.10 Create Tribe Eveness
The purpose of this step is to calculate the Pielou’s evenness index (range 0-1), estimated at the tribe level. (will probably need to add a new column for tribe; dissolve on this with sample ID)
- In the feature class
Cordova_all_individuals, create a new text variable namedtribe. - Use the
Field Calculatortool on thetribefield to calculate its value using the following Python expression:!Ename!.split()[0] - Create a table of SampleID by tribe by abundance (number live). Use the
Dissolvetool:- Input Features:
Cordova_all_individuals - Output feature class:
Cordova_sampleid_tribe - Dissolve Fields:
SampleID,tribe - Statistics Fields:
NumberLive, SUM - Create Multipart: unchecked
- Input Features:
# Import ArcGIS feature class into R
cordova_sampleid_tribe <- arc2sp("//mvrdfs/EGIS/Work/EMP/HREP_Projects/SteamboatSlough/Mussels/SteamboatMusselModel/Data/SB_Mussels.gdb/SB_ILStatePlaneW/Cordova_sampleid_tribe")

# Convert sp object to a data frame
sample_tribe <- cordova_sampleid_tribe@data

# Remove OBJECTID field
sample_tribe <- sample_tribe[,-1]

# Convert to vegan community data matrix-like format using labdsv::matrify
sample_tribe_matrix <- labdsv::matrify(sample_tribe)
# Calculate the Shannon-Weaver diversity index
tribe_shannon_diversity <- vegan::diversity(sample_tribe_matrix, index = "shannon")
# Calculate the number species per site (see ?vegan::diversity)
tribe_number <- vegan::specnumber(sample_tribe_matrix)
# Use the following equation to calculate Pielou's evenness
# See the vegan Diversity Vignette for details
tribe_pielou_evenness <- tribe_shannon_diversity/log(tribe_number)
# Set NaN pielou_evenness values to zero
tribe_pielou_evenness <- ifelse(is.nan(tribe_pielou_evenness), 0,
tribe_pielou_evenness)
# Create a data frame of results
tribe_pielou <- data.frame(sampleid = names(tribe_pielou_evenness),
tribe_shannon_diversity,
tribe_number,
tribe_pielou_evenness)# Merge the Pielou scores back onto the sp object
sample_tribe_pielou <- sp::merge(x = cordova_sampleid_tribe,
y = tribe_pielou,
by.x = "SampleID", by.y = "sampleid")# Export to geodatabase
sp2arc(sample_tribe_pielou, fc_path = "//mvrdfs/EGIS/Work/EMP/HREP_Projects/SteamboatSlough/Mussels/SteamboatMusselModel/Data/SB_Mussels.gdb/SB_ILStatePlaneW/sample_tribe_pielou")- Create a table of SampleID by tribe Pielou evenness score. Use the
Dissolvetool:- Input Features:
sample_tribe_pielou - Output feature class:
tribe_pielou - Dissolve Fields:
SampleID - Statistics Fields:
tribe_shannon_diversity, MEANtribe_number, MEANtribe_pielou_evenness, MEAN - Create Multipart: unchecked
- Input Features:
7.11 Create ES 100
The purpose of this step is to calculate the ES 100 MCAT metric for each sampled site. ES_100 is the expected number of species with a sample size of 100 estimated by rarefaction based on random resampling of the data (Dunn, Zigler, and Newton 2016).
ES_100-species richness estimated by rarefaction; caveat: sites need to be compared based on an equal sample size because # of species and # of individuals sampled are large correlated. Not sure how best to approach this one; I defer to you!
# Uses the sample_species_matrix calculated from the species evenness section

# Calculate rarefaction using a sample size of 100
rarefy_es_100 <- vegan::rarefy(x = sample_species_matrix,
                               sample = 100)
## Warning in vegan::rarefy(x = sample_species_matrix, sample = 100):
## requested 'sample' was larger than smallest site maximum (0)# Calculate rarefaction using a reasonable sample size
rarefy_rowmedian <- vegan::rarefy(x = sample_species_matrix,
sample = median(rowSums(sample_species_matrix)))## Warning in vegan::rarefy(x = sample_species_matrix, sample =
## median(rowSums(sample_species_matrix))): requested 'sample' was larger than
## smallest site maximum (0)# Create a data frame of results
rarefy_species <- data.frame(sampleid = names(rarefy_es_100),
rarefy_es_100,
rarefy_rowmedian,
shannon = diversity(sample_species_matrix),
specnumber = specnumber(sample_species_matrix))# Merge the rarefaction scores back onto the sp object
rarefy_sampleid_species <- sp::merge(x = cordova_sampleid_species,
y = rarefy_species,
by.x = "SampleID", by.y = "sampleid")# Export to geodatabase
sp2arc(rarefy_sampleid_species, fc_path = "//mvrdfs/EGIS/Work/EMP/HREP_Projects/SteamboatSlough/Mussels/SteamboatMusselModel/Data/SB_Mussels.gdb/SB_ILStatePlaneW/rarefy_sampleid_species")- Create a table of SampleID by tribe Pielou evenness score. Use the
Dissolvetool:- Input Features:
rarefy_sampleid_species - Output feature class:
rarefy_samples - Dissolve Fields:
SampleID - Statistics Fields:
SUM_NumberLive, MEANrarefy_es_100, MEANrarefy_rowmedian, MEANshannon, MEANspecnumber, MEAN - Create Multipart: unchecked
- Input Features:
7.12 MCAT Metric Site Level Thresholds
The descriptive statistics presented in the previous section were used to select MCAT metrics thresholds.
| Metrics | Poor | Fair | Good | Site Threshold | No. of Sites |
|---|---|---|---|---|---|
| % listed | <0.6 | 0.6-3.6 | >3.6 | >3 | 34 |
| % tolerant | >62.7 | 38.3-62.7 | <38.3 | <40 | 72 |
| % lampsilini | <17.2 or >56.4 | <17.2-34.7 or >39.5-56.4 | >34.7-39.5 | >40 | 93 |
| % juveniles | <19.8 | <19.8-49.3 | >49.3 | >50 | 72 |
| % >= 15 years | <0.8 or >16.0 | >5.6-16.0 | >2.4-5.6 | >5* | 13 |
| abundance | <8 | 8-13 | >13 | >13 | 62 |
| species evenness | <0.665 | 0.665-0.780 | >0.780 | >0.7 | 98 |
| tribe evenness | <0.719 | 0.719-0.823 | >0.823 | >0.8 | 86 |
| ES 100 | <11.5 | 11.5-15.7 | >15.7 | >3* | 49 |
| * The site threshold for this metric is lower than the bed threshold due to the lower number of individuals of each species found at each sampled site. |
7.13 Calculate MCAT Site Score
The purpose of this section is to calculate an MCAT Site score. This score is composed of the number of MCAT metrics met for each site. A site that meets none of the MCAT metrics receives a score of zero while a site that meets all of the scores receives a score of nine.
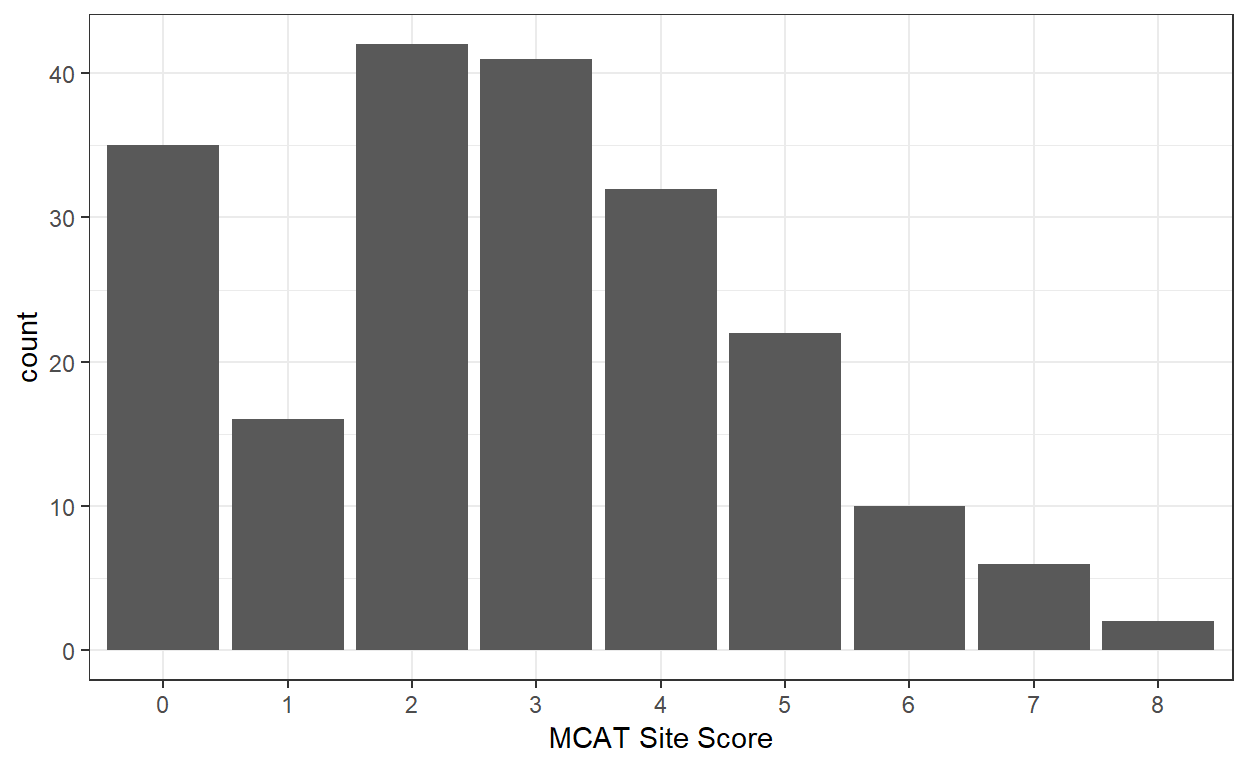
Figure 7.2: Frequency of MCAT Site Scores.
7.14 Export to Maxent “SWD” format
The purpose of this step is to assign the ADH predictor variables (and optionally the wind/wave variables) to each MCAT metric. The Maxent documentation refers to this format as the “Samples With Data” (SWD) format because it contains the samples (i.e., sample identifier, latitude, longitude) with the environmental predictor variables (e.g., q5_velocity, q5_depth, q5_slope, etc.).
In the
samples_mcatfeature class, add 3 fields named:speciesType = string and Length = 20longitudeType = doublelatitudeType = double- Use the Field Calculator tool to populate the
speciesfield using the following expression:species = "mcat". - Use the Calculate Geometry tool to populate the
longitudeandlatitudefields, ensuring that the coordinate system is set toNAD 1983 2011 US FeetandStatePlane Illinois West FIPS 1202and the units are set toUS feet. Use the Extract Multi Values to Points (spatial analyst) tool to write the raster values (
q5_velocity,q5_depth,q5_slope,q5_ss,q5_reynolds,q5_froude,q95_velocity,q95_depth,q95_slope,q95_ss,q95_reynolds,q95_froude) to each point in thesamples_mcatfeature class and thebackgroundfeature class (Section 5.2 of this document).- Input point features:
//mvrdfs/EGIS/Work/EMP/HREP_Projects/SteamboatSlough/Mussels/SteamboatMusselModel/Data/SB_Mussels.gdb/SB_ILStatePlaneW/samples_mcat - Input rasters:
q5_velocity,q5_depth,q5_slope,q5_ss,q5_reynolds,q5_froude,q95_velocity,q95_depth,q95_slope,q95_ss,q95_reynolds,q95_froude - Repeat the previous step for
background
- Input point features:
Ensure all layers have same spatial reference before running the tool.
- Select only records from the
samples_catfeature class where themcat_site_score>= 4. Create a definition query using the following expression:mcat_site_score>= 4 Export these selected records to a
.csvfiles namedmcat.csvto the following folder://mvrdfs/egis/Work/EMP/HREP_Projects/SteamboatSlough/Mussels/SteamboatMusselModel/Maxent/existing_condition/input_swd- Repeat the Extract Multi Values to Points step for the
backgroundfeature class to add environmetal predictor to the background points. - Export the
backgroundattribute table as a.csvfile to theinput_swdfolder listed above. Ensure the
ObjectIDfield is deleted in Excel prior to use in Maxent.
References
Dunn, Heidi, Steve Zigler, and Teresa Newton. 2016. “Validation of a Mussel Community Assessment Tool for the Upper Mississippi River System.” 2014 MCA2. Rock Island, IL: U.S. Army Corps of Engineers, Rock Island District.